Amplitude amplitude coupling#
The measurement of amplitude amplitude coupling is a very commonly used and effective function. Below, I will provide a detailed explanation of the call parameters of functional phase amplitude coupling, as shown in source code, and give appropriate examples.
Single signal AAC#
We calculate amplitude amplitude coupling (PAC) in single channel, which means the amplitude modulation of a signal corresponds to the amplitude of the same signal.
selected_funcs is ‘aac_connectivity_mod’
- Selected Function:
aac_connectivity_mod__mod- Sample Frequency:
aac_connectivity_mod__sfreq: 250 Hz- Frequency Bands:
- AAC Phase Band:
[4, 8] (Theta)- AAC Amplitude Band:
[30, 45] (Gamma)- Mode:
aac_connectivity_mod__mode: ‘self’ (Single signal)We calculate AAC for a 250 Hz single channel for theta amplitude to gamma amplitude.
[4]:
fea1 = Feature(data = data, sfreq=250, selected_funcs=['aac_connectivity'],
                       funcs_params={
                                     "aac_connectivity__sfreq": 250,
                                     "aac_connectivity__band": np.array([[4, 8], [30, 45]]),
                                     "aac_connectivity__mode": 'self'
                                     } )
[5]:
n_epcoh, n_channels, aac_value = fea1.features.shape
print(f"data.shape: {n_epcoh} epcoh X {n_channels} channels X {aac_value} aac_value")
data.shape: 2 epcoh X 5 channels X 1 aac_value
Different signals AACs#
The amplitude and amplitude modulation between different signals is similar to a functional connection between different signals.
selected_funcs is ‘pac_connectivity_mod’
- Selected Function:
aac_connectivity_mod__mod- Sample Frequency:
aac_connectivity_mod__sfreq: 250 Hz- Frequency Bands:
- AAC Phase Band:
[4, 8] (Theta) seed - AAC Amplitude Band: [30, 45] (Gamma) target- Mode:
aac_connectivity_mod__mode: ‘non-self’ (Different signals)We calculate AAC for a 250 Hz multi-channel for theta amplitude to gamma amplitude.
[6]:
data = np.random.rand(2, 5, 1000)
fea1 = Feature(data = data, sfreq=250, selected_funcs=['aac_connectivity'],
                       funcs_params={
                                     "aac_connectivity__sfreq": 250,
                                     "aac_connectivity__band": np.array([[4, 8], [30, 45]]),
                                     "aac_connectivity__mode": 'non-self'
                                     } )
[7]:
n_epcoh, n_channels, n_channels = fea1.features.shape
print(f"data.shape: {n_epcoh} epcoh X {n_channels} channels X {n_channels} n_channels")
data.shape: 2 epcoh X 5 channels X 5 n_channels
Visualization of AAC#
[8]:
sns.heatmap(fea1.features[0])
[8]:
<Axes: >
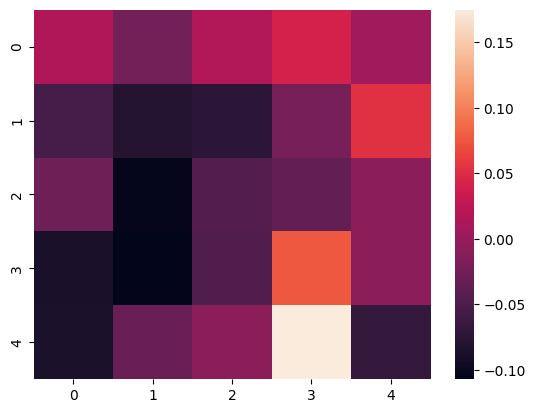
fea2.features[k,i,j] represents that the i-th channel signal of theta phase modulate the j-th channel signal of gamma amplitude for k-th epcoh data.
[9]:
fig, ax = plt.subplots(figsize=(8, 8),  facecolor="Black", subplot_kw=dict(polar=True))
plot_connectivity_circle(fea1.features[0], [f'Chan {i+1}' for i in range(n_channels)],
                         title = f'AAC connectivity', colormap = "hot",  colorbar_size = 0.35, colorbar_pos = (0, 0.5), ax=ax)

[9]:
(<Figure size 800x800 with 2 Axes>,
 <PolarAxes: title={'center': 'AAC connectivity'}>)